The Dow hit a new record high of 14,253.77Â today and at least I was very surprised by this new record. There were a couple of things that caught my eye while browsing through stories about this high, and I was curious to see how they were applicable in an Indian context.
The first one was simply that the Dow has more than doubled from its 2009 low, and the last 4 years have been a great bull market. I’m not sure how I feel about that. It is factually correct, but if you recall the terrible sentiment that existed in the last four years, I don’t know that you would have known you are in a bull market from that.
But does it hold true in an Indian context as well? Has the Sensex more than doubled in the last four years?
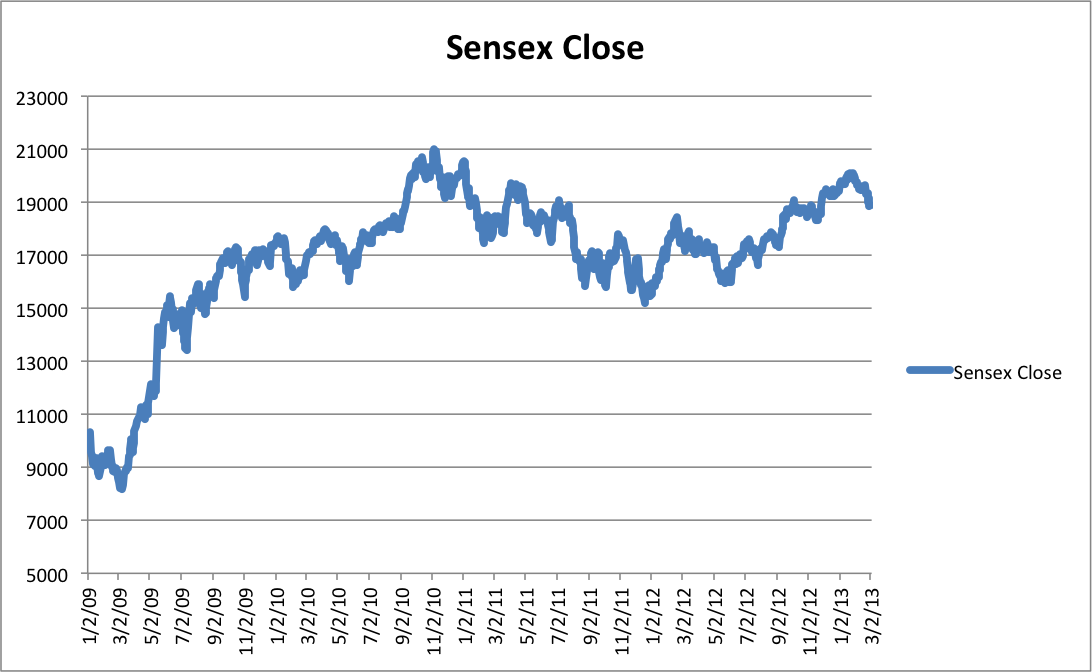
A chart is in order. This is the Sensex close from Jan 2009 till yesterday.
The lowest point on this chart is 8,160.4 on September 3 2009. So, yes, the Sensex has more than doubled in the last 4 years. But the more important question is – have you taken advantage of this move?
Sensex High Adjusted for Inflation
The second thing that I saw at a few places today was that sure the Dow has hit a high, but it hasn’t been able to beat inflation. This made me wonder what the Sensex high would be if it were adjusted for inflation?
The all time Sensex closing high is 21,004 on November 5 2010.To adjust this for inflation, I went to the website of Labour Bureau of India.
They have historical CPI inflation data there, and I was able to look at the number for November 2010, and January 2013 (latest month for which number is available) and adjust the Sensex high for inflation.
The CPI index for November 2010 was 182, and the number for January 2013 was 221. So you can derive the Sensex high adjusted for inflation as (221/182) x 21004.
This comes out to be 25,505.
So based on this crude method, I’d say that Sensex high adjusted for inflation should be 25,505 and we shouldn’t be rejoicing till the Sensex blows past this number, but then given the current situation, it would be good to just see a new nominal high.


afaik, the DJI and the SENSEX are price indexes and don’t include dividends. Looking at total returns, the DJI must have achieved an all time high earlier. And, similarly for the SENSEX, we might be closer to the all time high.
That is such a great point! The NSE Total Returns index includes dividends. I’ll see if I can create a similar chart for that.
Hi Manshu,
Dont you think it is unfair to consider all-time highs of these indices to analyse their returns vis-a-vis inflation? After all, this time period has been tough for these economies. Inflation never falls 50%, even if the economic environment is too bad, but the indices do.
It is the context in which it is being used. So if a fund manager comes on TV and says everything is fine, and everyone should start investing in stocks because we made a new high, – I think that is the time to bring up the fact that we just made a nominal high and not a real high.
As an acedamic excercise it is good.How will this knowledge influence the decision of a long term retail investor direct in equity or thro equity mutual fund?
I feel that this information is useful only to the extent that it tempers our enthusiasm when the new nominal high is broken next time, and tells us how far away we are in real terms.