Yesterday I wrote about some of the key highlights from the budget and today I’m going to take a look at the sources of government funds and how they contribute to the government coffers.
First, what are these sources?
1. Revenue Receipts – Tax Revenue: This is the tax that the government collects in the form of corporation tax, personal income tax, customs, excise etc.
2. Non Tax Revenue: These are things like interests on bonds held, dividends from PSUs, and grants. They are revenue sources meaning they don’t have to be repaid and are smaller than tax revenues.
3. Capital Receipts: These are borrowings of the government like the market loans, short term borrowings, external commercial receipts etc.
Now, some charts and the source for the data is the budget website.
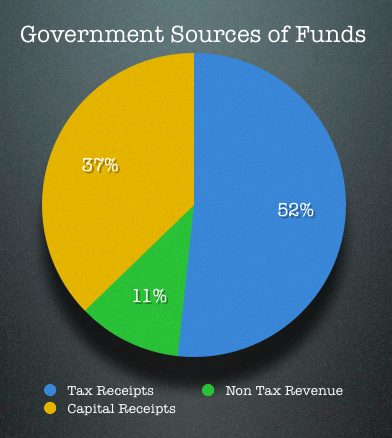
First, a pie chart of the top three sources.

Here is the table that shows the absolute numbers.
| Head | In Crore of Rupees |
|---|---|
| Tax Revenue | 7,71,071 |
| Non Tax Revenue | 1,64,614 |
| Capital Receipts | 5,55,241 |
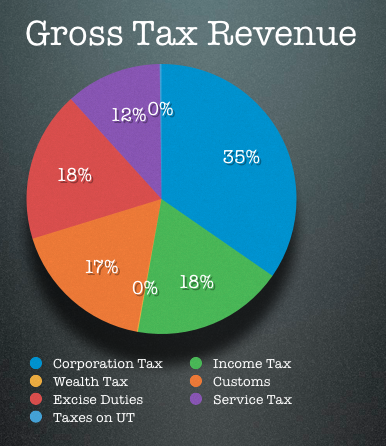
From the above chart, we see that tax revenues are the biggest contributor of money to the government, and now let’s take a look at what the tax revenues comprise of.

Let’s look at the numbers.
| Head | In Crore of Rupees |
|---|---|
| Corporation Tax | 3,73,227 |
| Income Tax | 1,95,786 |
| Wealth Tax | 1,244 |
| Customs | 1,86,694 |
| Excise Duties | 1,94,350 |
| Service Tax | 1,24,000 |
| Taxes on UT | 2,310 |
The striking thing about this chart is perhaps that corporate tax contributes twice as much as individual income tax.
Now, let’s move on to the second head which is the non tax revenues.
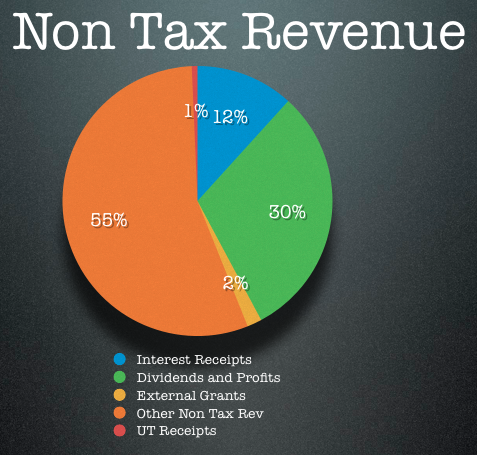
First, the chart.

Other tax revenues are dominated by the others column which are things like petroleum royalty and then of course dividends from PSUs come second.
Here are the absolute numbers and remember this is just 11% of the total government funds.
| Head | In Crore of Rupees |
|---|---|
| Interest Receipts | 19,231 |
| Dividends and Profits | 50,153 |
| External Grants | 2,887 |
| Other Non Tax Revenue | 91,207 |
| UT Receipts | 1,136 |
Now, let’s take a look at the last head which is the capital receipts or the government’s credit card.
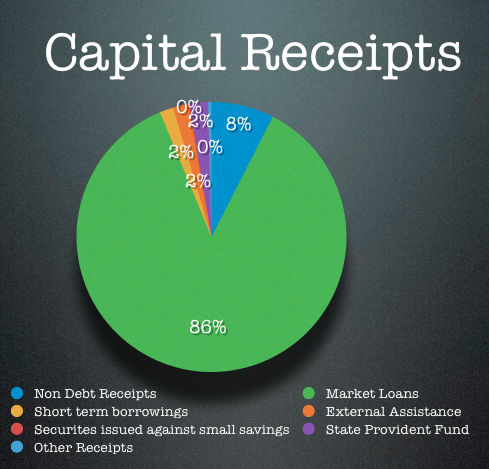
Here is how that looks like.

Borrowing contains, well, market borrowings and that’s the bulk of this part. Here are the absolute numbers.
| Head | In Crore of Rupees |
|---|---|
| Market Loans | 4,79,000 |
| Short Term Borrowings | 9,000 |
| External Grants | 10,148 |
| Small Savings | 1,198 |
| SPF Net | 12,000 |
| Other Receipts | 2,245 |
A few things that come to my mind looking at the numbers in the form of these pie charts – first, income tax collection is half of corporate tax collection and this when only about 3% of the population pays taxes – surely, the tax base needs to be widened.
Second, a large part of the funds are being raised by borrowing and while it’s good that a large part of this is money raised in INR – the interest payment on this debt eats into the money the government has left to spend on other things and that negatively affects the economy.
Finally, given that subsidies are a large expense for the government it’s hard to really see petroleum royalties as a genuine revenue source, and with crude prices skyrocketing there is an urgent need to rationalize oil subsidies.
What are your thoughts on these charts, do any of these ratios surprise you at all?

Hi manush,
Its surely an eye-opener, Interesting article, very simple and concept clearing article. Just need to understand the Concepts/Terminologies like wealth tax, corporation tax and Income Tax.
Also, it would be better if same explanation given for expenditure too.
Looking forward for your reply.
Thanks
can you tell us more about VAT and how its levied across India?????? and why petrol & diesel has around 50% VAT in every state?
Can you please tell me what is UT?
UT is union territory Kriti.
Excellent effort. Keep up the good work….
The Indian government must do something about rising trade deficit in India by investing more money on infrastructure in government PSU’s so as to make them more competitive in the foreign market, increasing FDI in defence from 26% to 90%, decrease corruption etc. The Prime Minister should take decisions that will make india economically stronger than China.
got many things i was looking for at one place…..brilliant….fantastic…great work to say the least….pls keep it up………..!!!!!!!!!!!!!
Simply excellent way to present 🙂
Simple excellent way to present 🙂
Hi, Its an eye-opener and thanks for the worthful information. I am going to share this information in my class… Hope, everyone atleast knew how india runs…
Vishnu Kumar
Amazingly simple and insightful write-up.
Thanks for giving such clear picture
Thanks for your comment Atul.
I was just thinking the same thing. Excellent post this is.
Good work simple and informative
Excellent effort. Keep up the good work….
Manshu
This is a good summary…can you put the expenditure side charts as well…that then will give us some intriguing insights.
Tushar
This is a very time consuming exercise and looking at the very few comments on this post I think it’s probably not worth it.
No no. It’s totally work it. I know it’s a time consuming task, but it is definitely worth it. More people read and very few comment. So if you find the time, please do make one for expenses as well.
Thanks a lot for education that you are providing and making us smarter day by day.
It was kind of interesting to see that personal income tax contributes only 13% to the govt income, because I always had this perception that IT paid by the common man is what majorly runs the govt. Also, its good to know that IT, customs and excise contribute almost equally.